Marketing Benchmarks for virtual assistants
Virtual Assistant Marketing Stats
We all know we should track our marketing – but how do we know what’s good and if we’re doing well? I’ll give you an example:
I had a really good giggle recently at a social media training event… The “experts” were boasting that one of the blogs they managed “got over 10,000 hits a month” – my dad’s personal blog where he muses about loo roll, the dog and his Romanian goats gets over 32,000 hits a month!!!
So what’s a good marketing conversion rate for virtual assistants?
Email marketing:
Open rates:
In an ideal world, you’d want everyone who got sent your email to read it, but open rates don’t tell the whole story… They are recorded by the images being downloaded from the email server – so anyone who has images switched off or can only get plain text emails won’t register as having opened your email. Aweber records their average open rate as 13.6% – which is pretty dire. From a double opt in list of active subscribers I’d expect to see around 30-40% open rates minimum. All sorts of things will affect your open rate though: the industry you’re targeting, whether these are personal/business emails, how often people check their emails, where the list was generated from.
Ways to improve: Make your list super active – make sure they have actively subscribed and that you regularly keep in contact with them with information that will be useful to them, rather than just sales patter!
Click thru rates:
In Marketing Sherpa’s Email Marketing Benchmark Report for 2012, email marketers reported an average clickthru rate of 26%. That’s brilliant! Remember these are specialist email marketers who drive traffic solely to website links. Your call to action might be to phone you or reply to the email, neither of which will be recorded. I’d expect around 10%-15% clickthru rates from most email campaigns.
Ways to improve: Make your offers interesting and have links that land on specific pages for the information they are looking for (splash pages/landing pages). Make it clear what the call to action is – what do you want them to do?
Spam reports:
In our fantasy land of perfect email marketing, this would be 0%. Realistically you’ll always get a few – people forget they’ve subscribed to your list or want to unsubscribe and don’t realise reporting as spam is not the same as unsubscribing.
Ways to improve: Make it easy to unsubscribe from your list – put links at both the top and bottom of the email in a prominent place. Make sure you are getting people to confirm their subscription by using a double opt in email provider.
Lead conversion:
Personally I have a 5% conversion rate on my leads… That sounds low – but it usually consists of completely cold leads and I’m pretty fussy about who I actually want to work with. You’ll also find certain marketing generators are easier to convert than others: e.g. a referral from another client might have a 90% conversion rate, whereas a cold call list of plumbers might be 1 in 100 leads becoming a client.
Here’s a few more:
| Aweber average open rate for email marketing | 13.6% |
| Marketing Sherpa email click thru rate for professional marketers | 26% |
| Direct Mail | |
| Average response for a cold list | 1% |
| Website Hits for UK Virtual Assistants | |
| 0-50 visits per month | 53% |
| 50-200 visits per month | 19% |
| 200-500 visits per month | 9% |
| 500+ visits per month | 19% |
| Twitter Followers for UK Virtual Assistants | |
| 0-25 | 10% |
| 26-50 | 3% |
| 51-100 | 8% |
| 101-200 | 8% |
| 201-500 | 14% |
| 501-1,000 | 13% |
| 1,000+ | 18% |
| N/A – don’t have a Twitter account | 27% |
| Facebook Followers for UK Virtual Assistants | |
| 0-25 | 13% |
| 26-50 | 6% |
| 51-100 | 20% |
| 101-200 | 15% |
| 201-500 | 13% |
| 501-1,000 | 4% |
| 1,000+ | 2% |
| N/A – don’t have a Facebook business page | 29% |
Website Hits
Something I genuinely had to research for this article – I know my own web stats, but I genuinely had no idea how many web hits the average VA got. So we included it in The UK VA Survey – it makes a great marketing stat when compared with turnover!
Blog posts:
HubSpot commissioned a survey benchmarking 7,000 UK businesses and their social media results recently and got some interesting results. The good news is: Small businesses with under 10 employees tend to see the biggest gains in traffic when they post more articles and companies who blog 1-2 times a month generate 70% more leads that those who don’t blog.
The bad news: Companies that blog 15 x or more per month get 5 x more traffic than those who don’t blog. Do you really have 15 articles in you each month? That’s almost a full time job when you take into account research time and time it takes the creative urge to emerge! (Well for me anyway!).
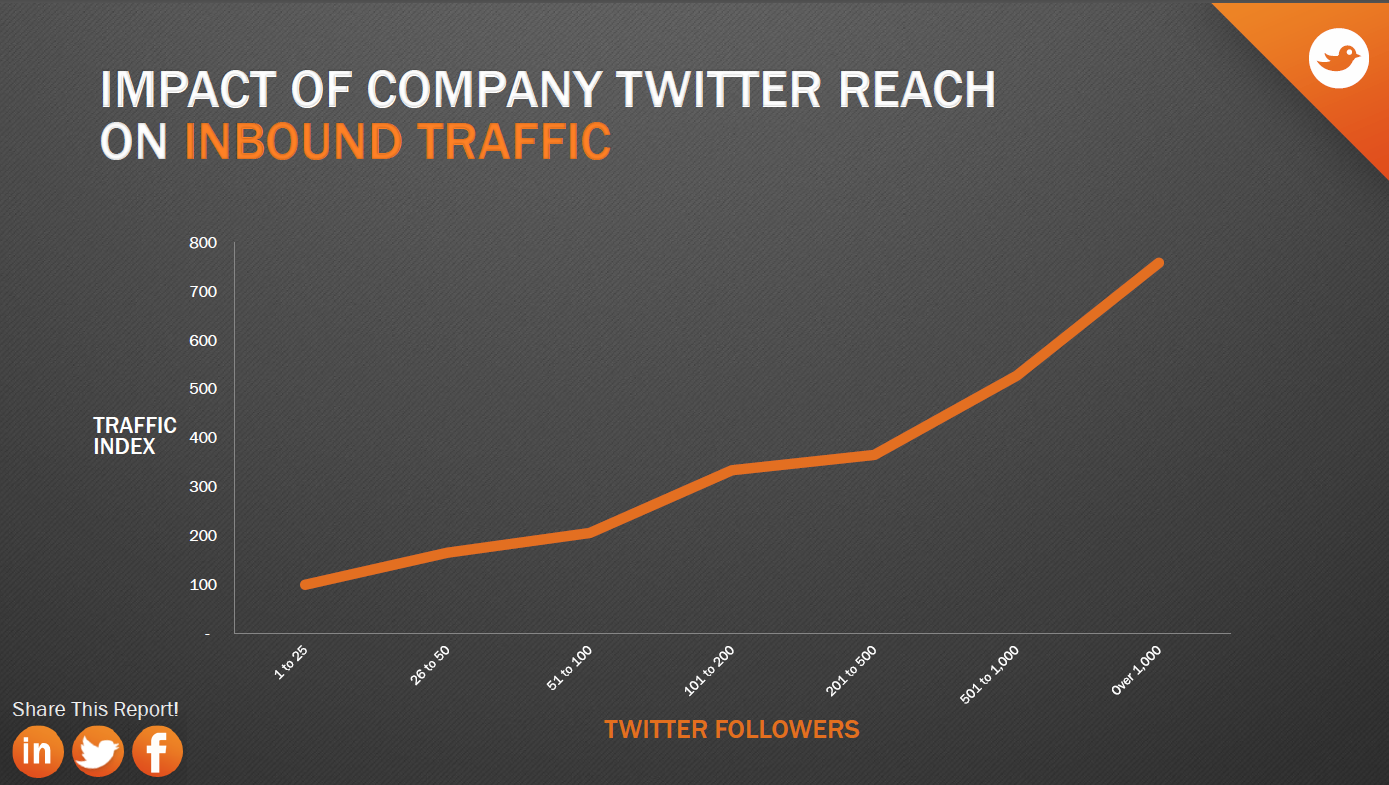
Twitter:
Again HubSpot’s research provides some interesting figures on Social Media – the growth in inbound traffic increases gradually until you hit 500 twitter followers, whereupon is rises rapidly. 500+ followers is your Holy Grail!
Facebook:
Facebook shows a similar trend but you’ll need even more followers to gain significant traffic from your Facebook page – over 1,000.
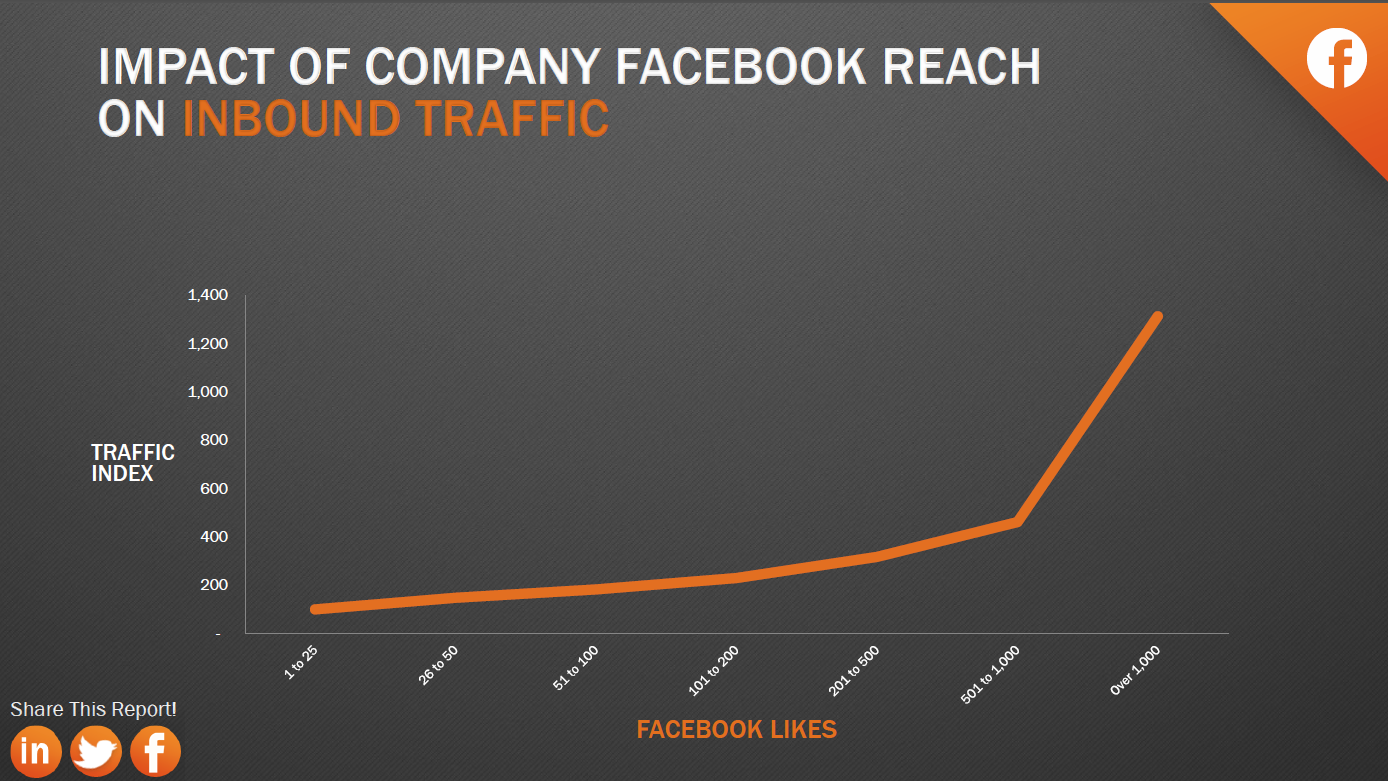
Which beggars the question: unless you have these numbers of followers, is social media worth investing time in for generating leads to your website? This insight would have a significant impact into the kind of posts you make to Facebook/Twitter – rather than focusing on sharing information to drive traffic to your website, you’d be better to target one-on-one to build relationships and use it as a lead generator.
Hopefully these stats will give you some confidence in your own marketing and how it benchmarks against other VAs.